...
Registrants - Name, Email, Company, Job Title, Code, IP address, Country, Last Logged In, Type of registration, Event Group, Content Group.
Devices - a pie chart with percentages of device type: Desktop, Mobile, Tablet
Locations - a map with list of countries (defined by IP address)
...
Welcome Video Analytics
Number of views and emails tracked for users who watched the welcome video.
...
Sessions
Live Session Attendees - Name, Email, Company Name, Job Title, Country, Session Name, Session Start Time, Joined On, Duration of session watched.

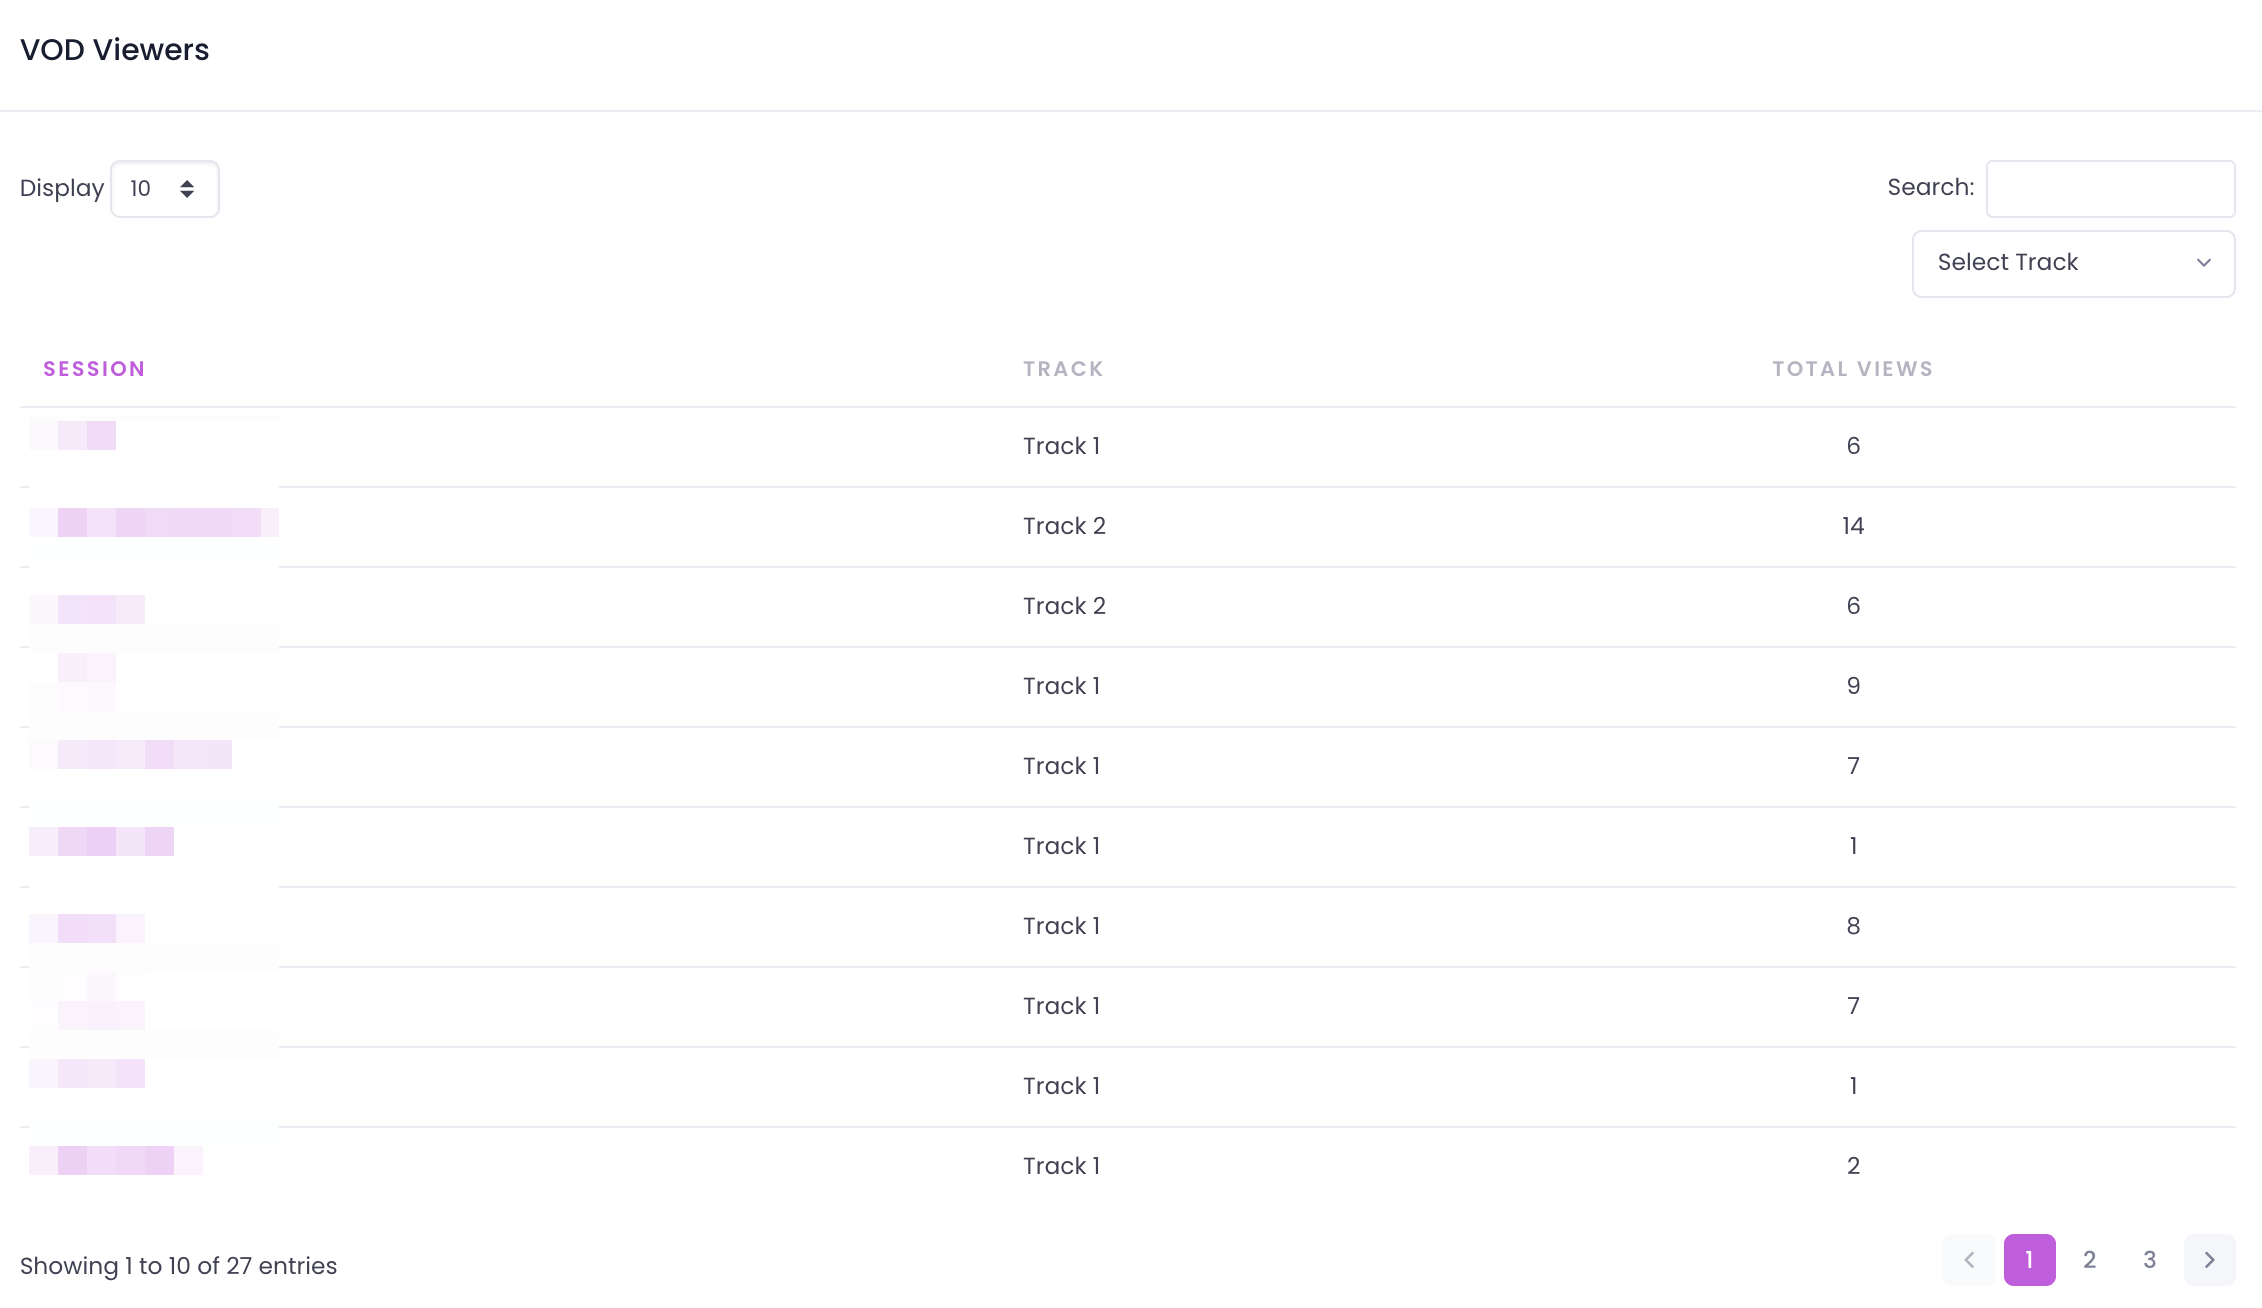
VOD Viewers - list of VOD sessions, Track, Total Views. Option to click into session name for details:
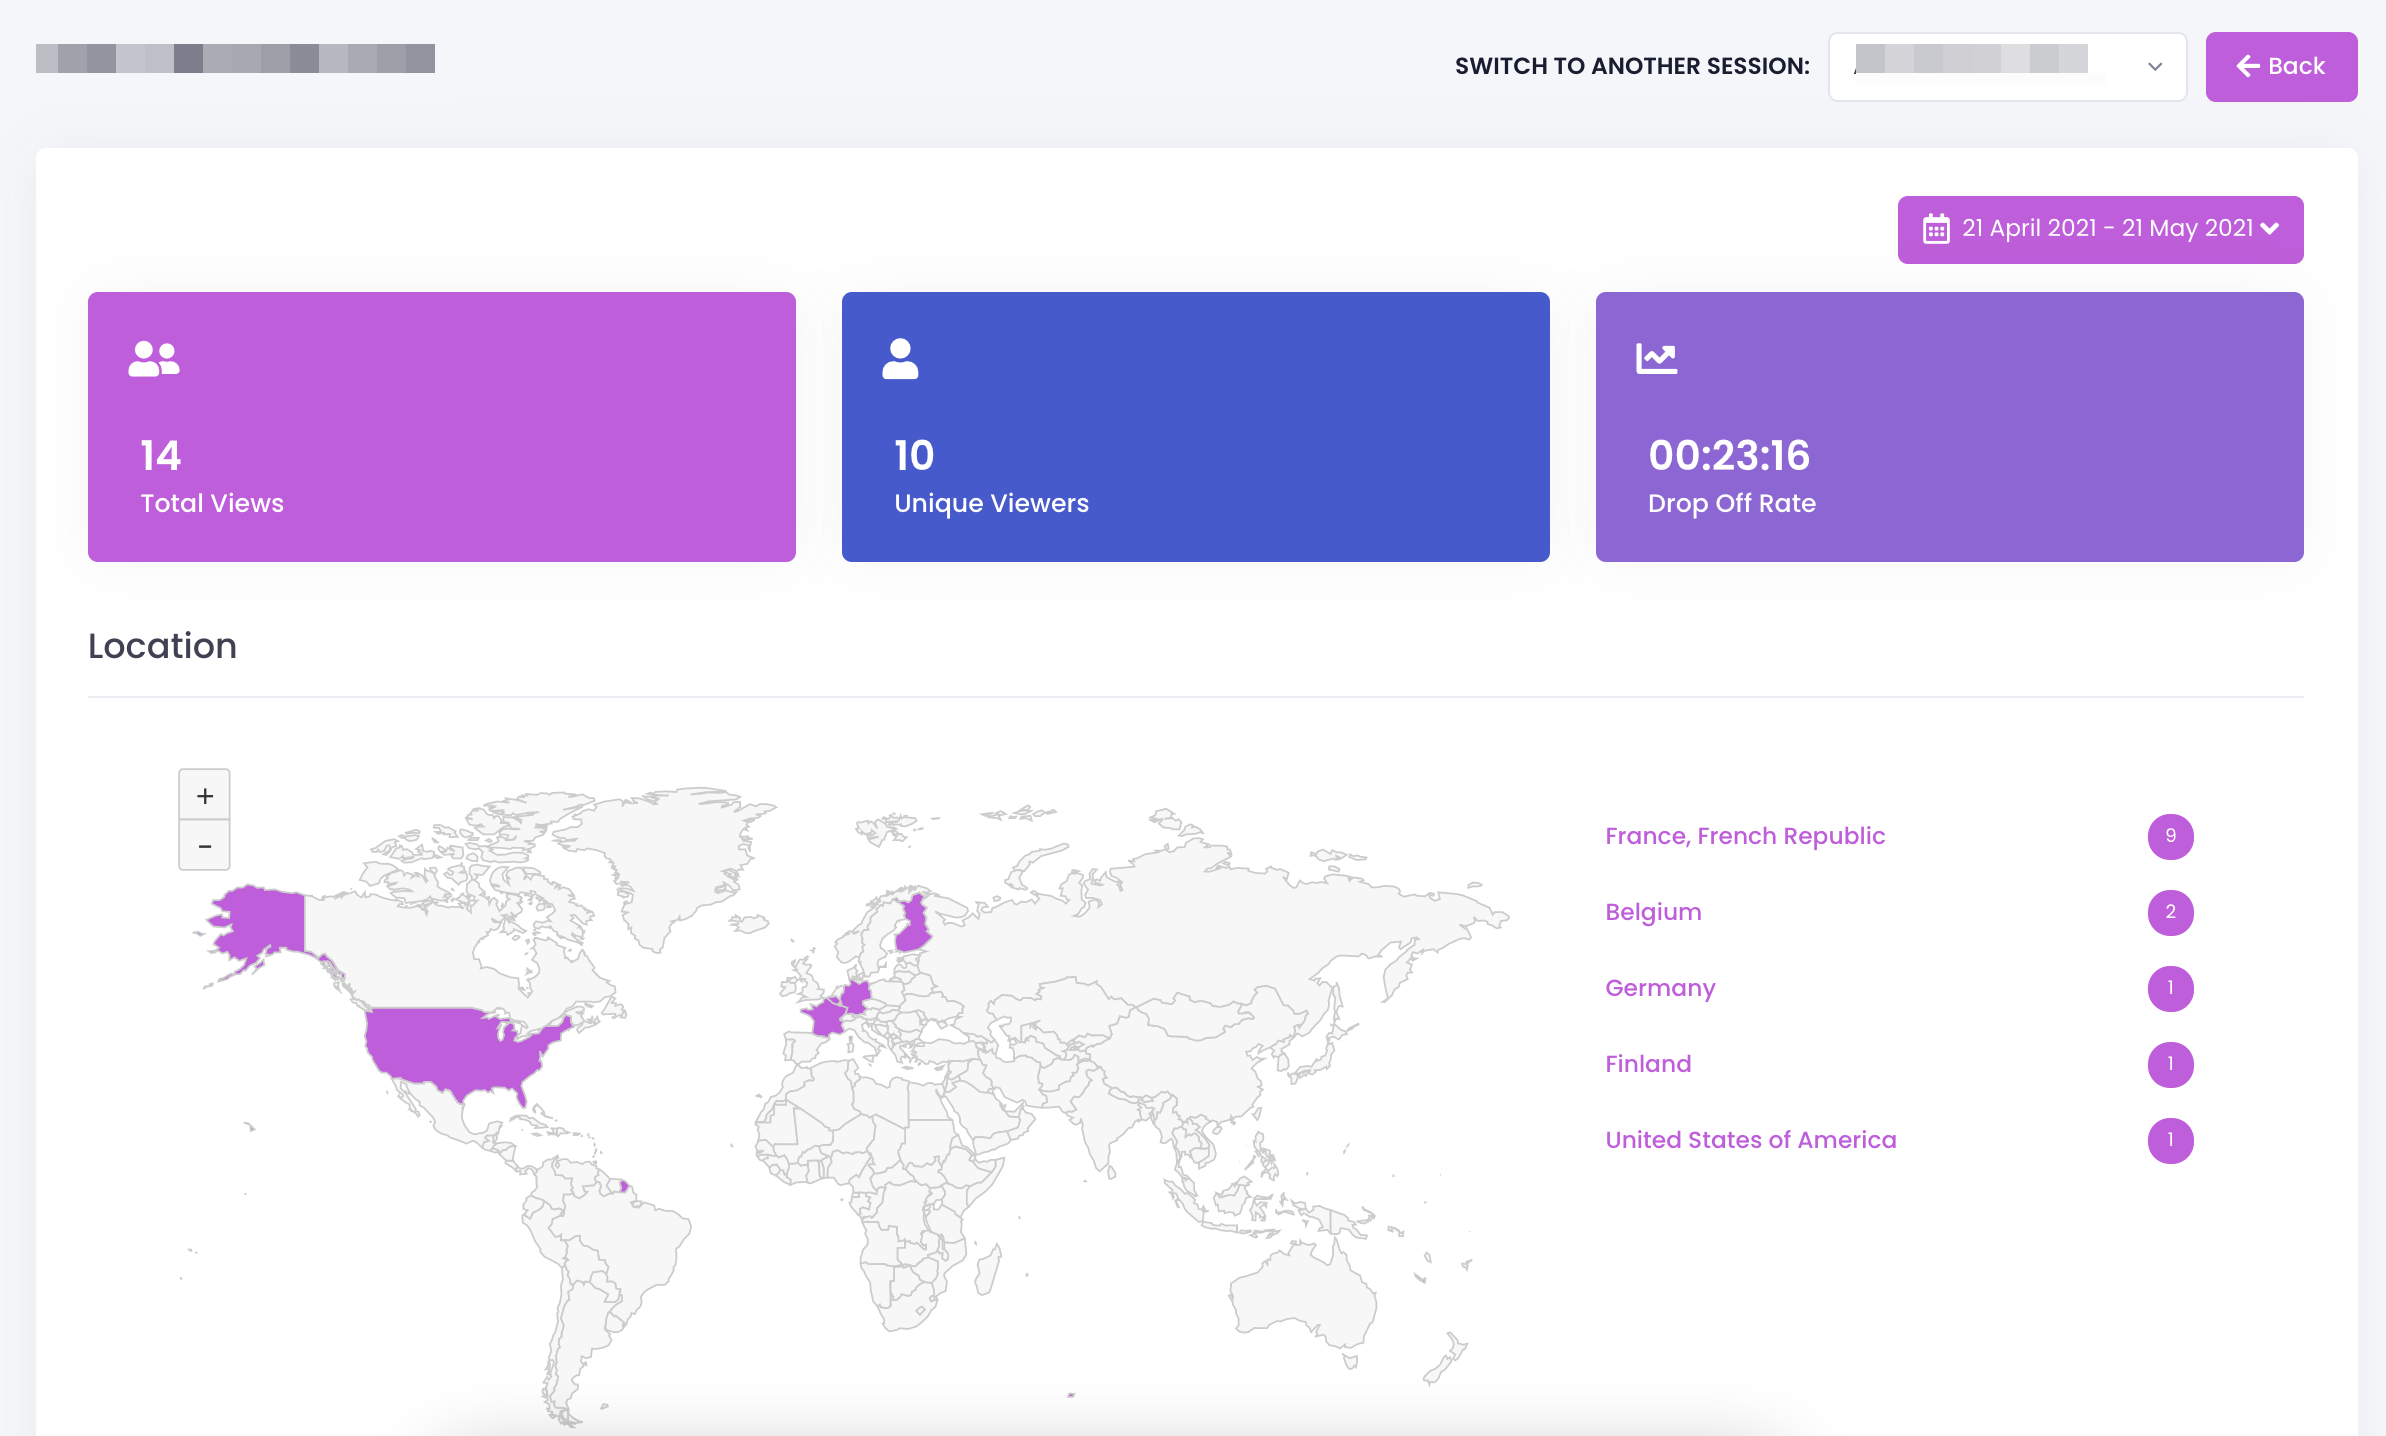
locations of users who watched the session
total views vs. unique viewers
drop-off rate
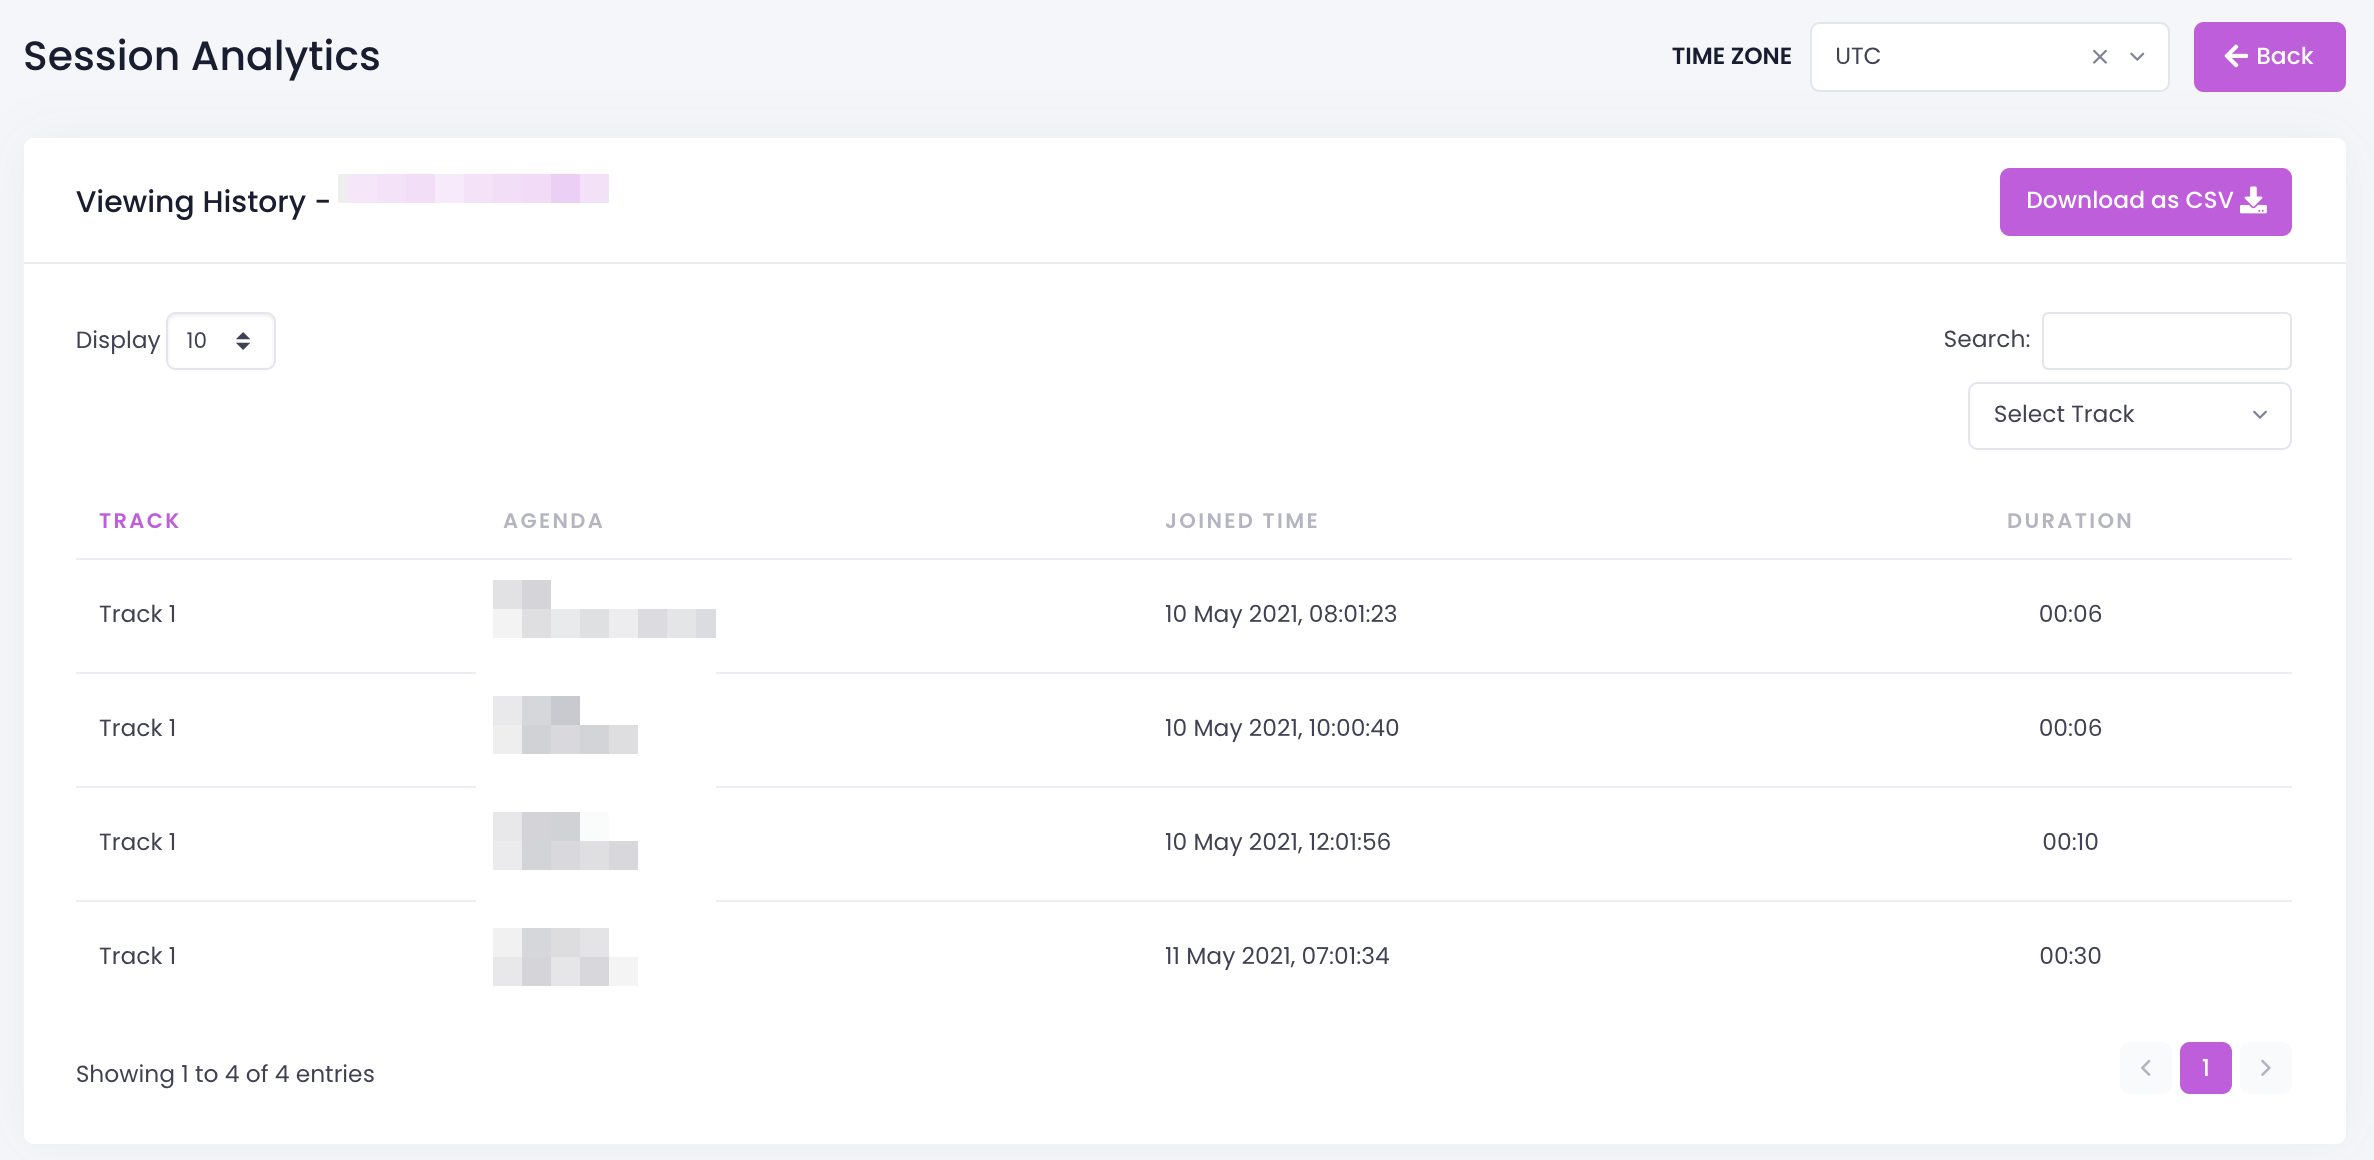
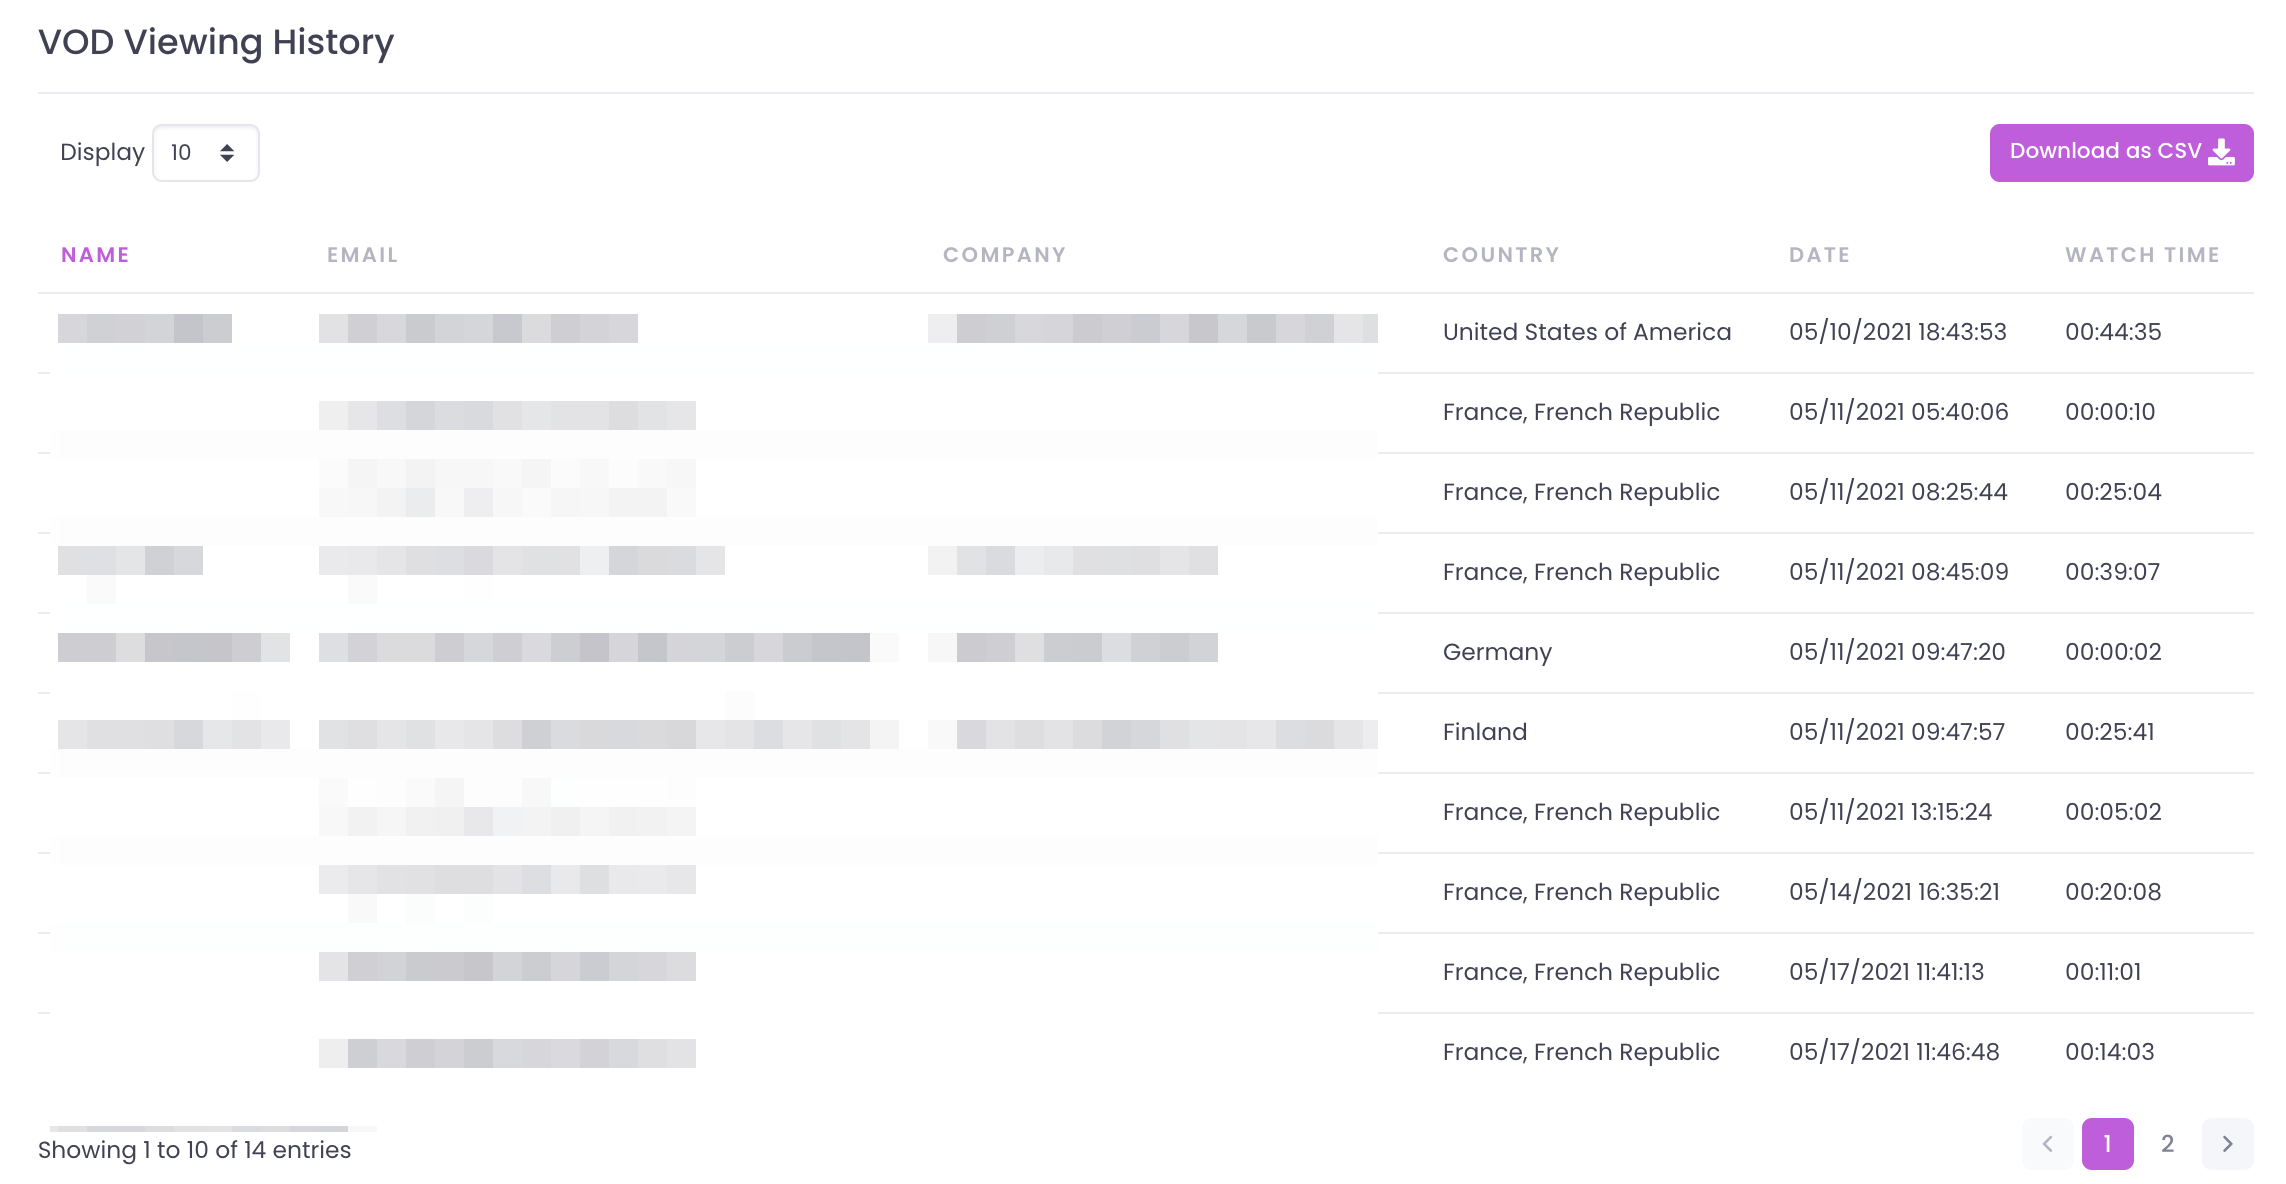
viewing history
3. Session Engagement - a chart with session engagement curve per each session
...
...
Resources
...
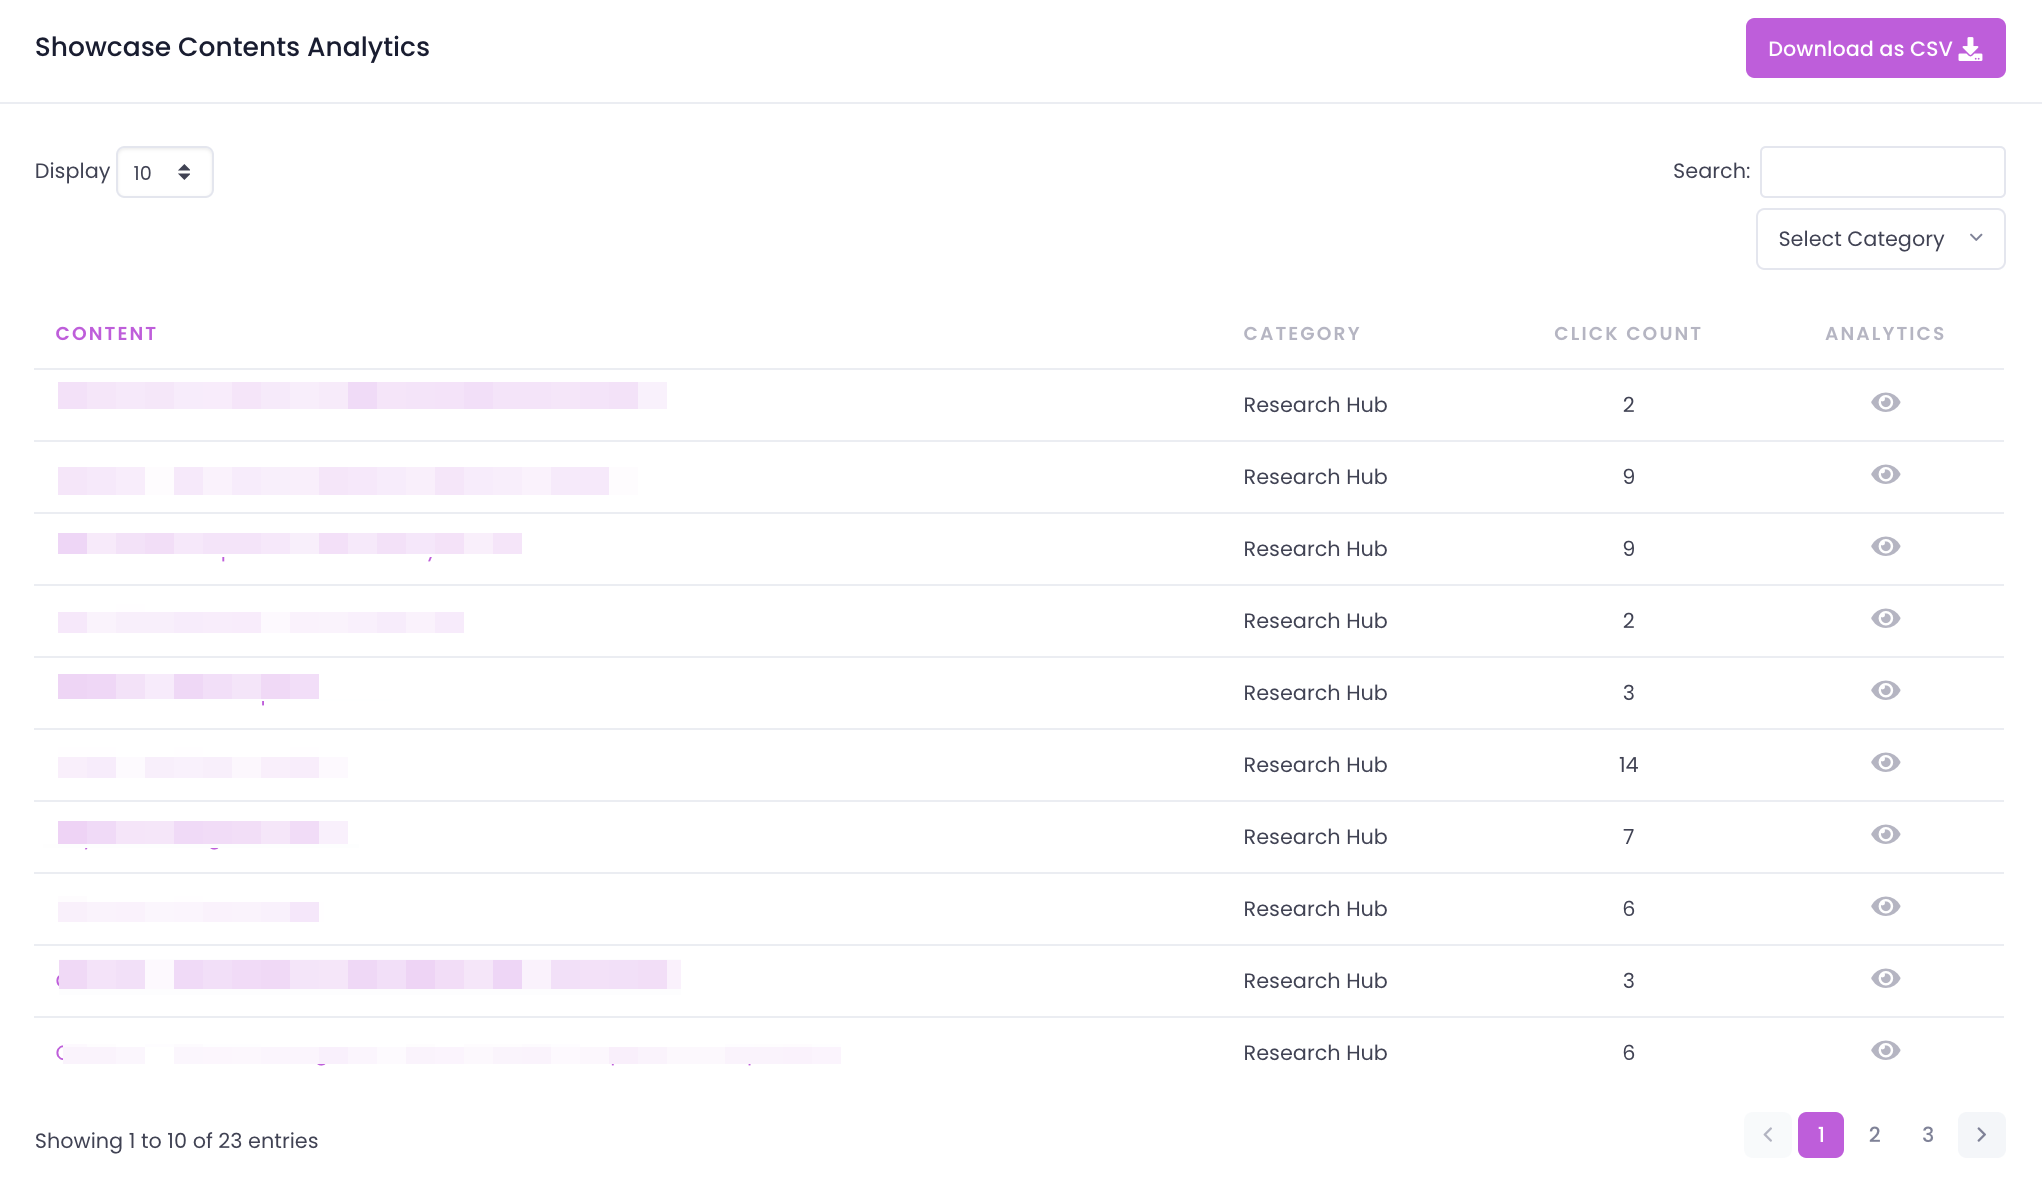
Showcase Resources Attendees - Name, Email, Company Name, Category (if the resources were put into categories), Content (Name of the resource), Number of clicks.
Showcase Resources Content Analytics - list of resources with their names, category assigned, total number of clicks, viewing history (for video files)
Attachments/Handouts
Event Agenda Handouts - click count on all handouts/attachments added to event agenda items (sessions)
Bio/Speakers Handouts - click count on all handouts/attachments added to the Bio/Speakers section
Sponsor Agenda Attachment - click count on all handouts/attachments added to the Sponsor microsite
Company Agenda Attachment - click count on all handouts/attachments added to the Company microsite
...
Chat/Networking
User Email, Number of messages sent in group chats, number of messages sent in direct messages, number of DM conversations user engaged in.
...
Polls
List of sessions during which the polls were used, with the total number of polls launched per session.
List of polls launched during the event with total clicks. Option to read details for each poll:
answers with percentages for each option
voting history with list of users, option they clicked and time they clicked it
...
Q&A
List of questions submitted during sessions with:
session name, track
question submitted
user email
time it was submitted.
...
Meetings
List of users and meetings links they clicked during the event.
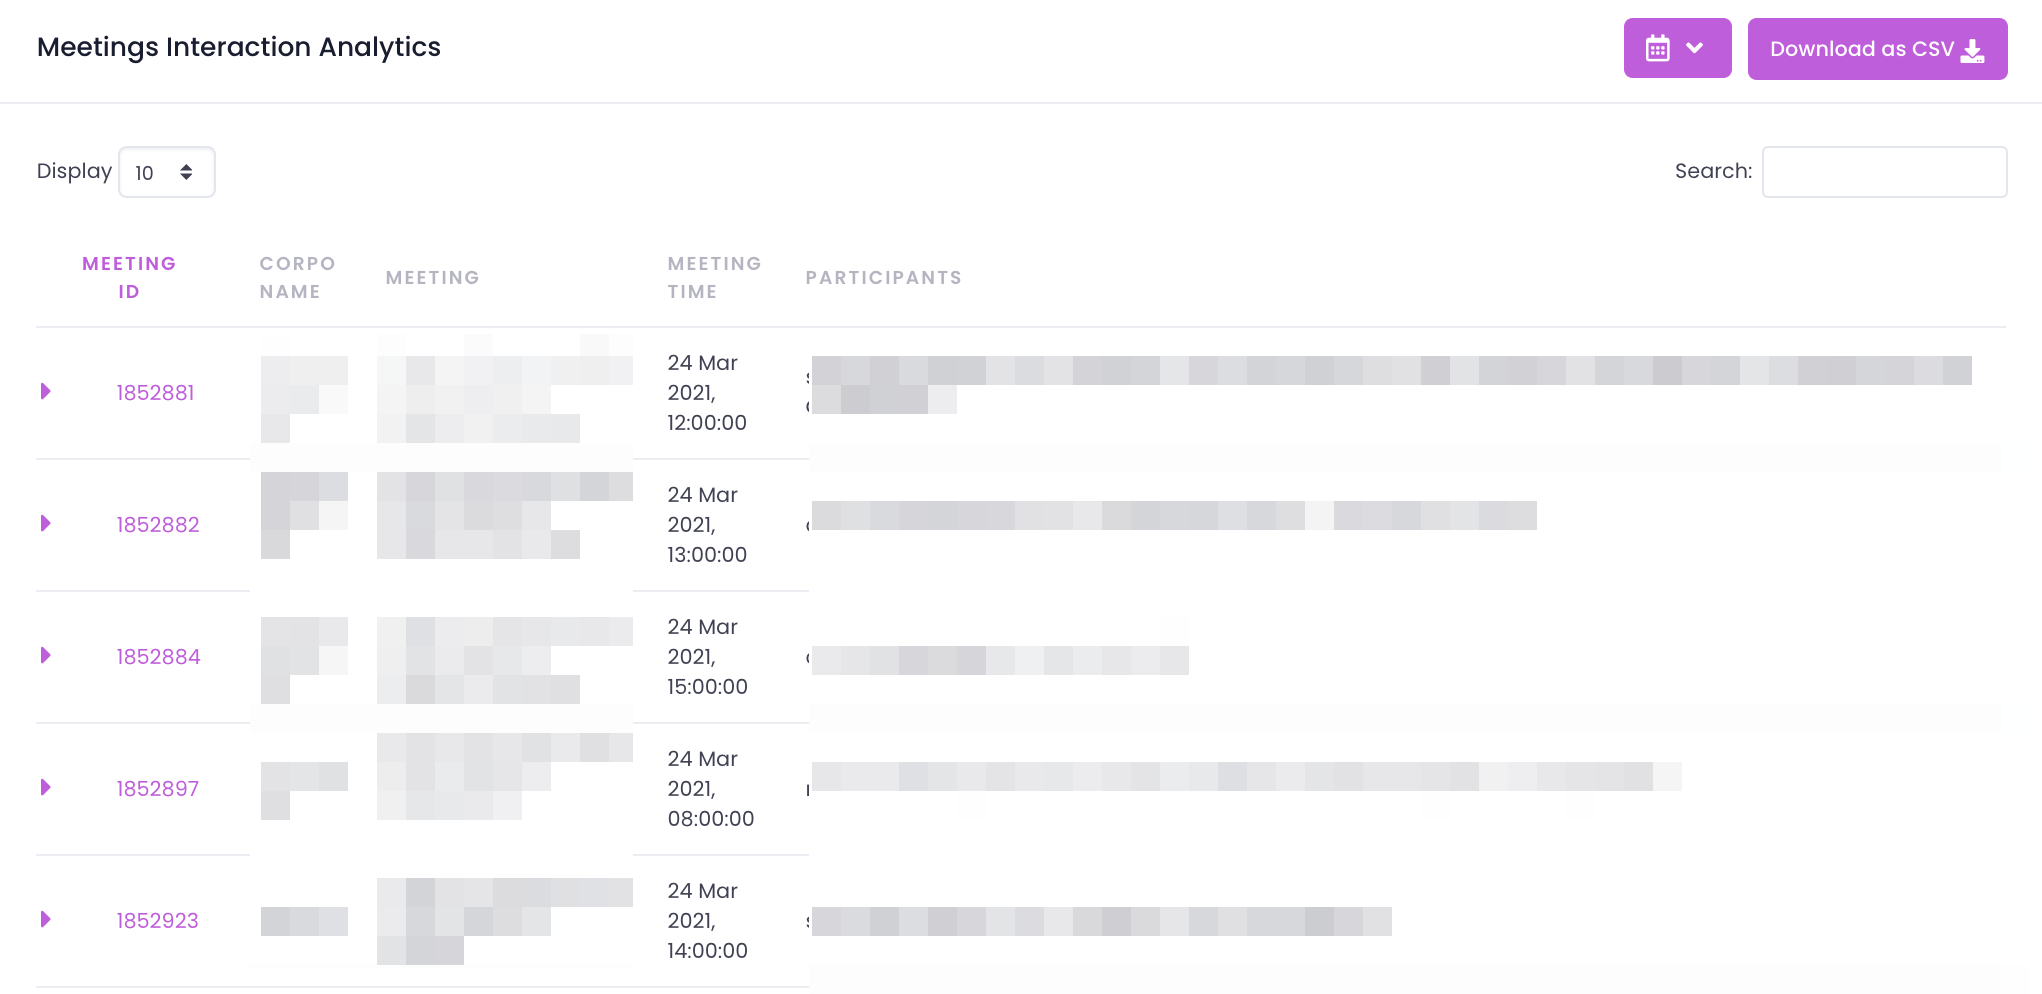
List of meetings - meeting name ID, meeting time, number of users invited and clicks. Option to read details per each meeting (pulled from Webex):
name
email
company
device
IP address
invited (yes, no)
join time
leave time
duration (minutes)
...
Embed Analytics
List of sessions embedded externally via the embed link with the following data tracked (all data is anonymous as Touchcast can’t get user emails from external websites):
Visit Count - number of visits to the embedded page
Unique View Count - number of unique views of the embedded page
Live Watch Count - number of views for the live session
VOD Watch Count - number of VOD views with detailed info
...
Link Share Analytics
Tracks data on links shared from the player for specific sessions:
Track Name
Session Title
Shared Link
Total Views
...
Agenda Card Analytics
Number of clicks on session cards:
...