TouchCast Fabric Portal: How can I view analytics for my touchcasts?
- Leena Abraham (Deactivated)
- Alison Witt (Deactivated)
Yes, it's possible to view analytics for each of the touchcasts that you create.
TouchCast provides two levels of analytics.
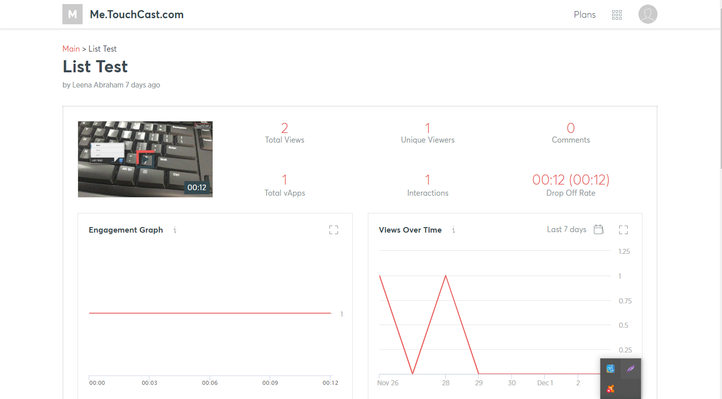
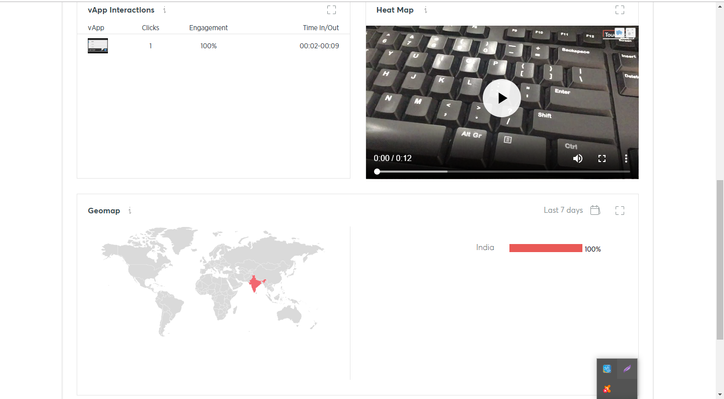
1. Combined analytics for the touchcast, including total views, unique views, geo location of views and percentage of views that interacted with content.
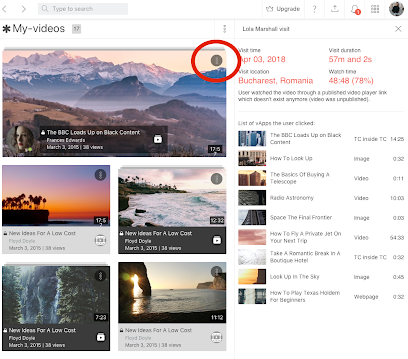
2. Individual session views for a touchcast. Using this data you can see each viewer, how long they viewed, when they viewed, how many times and the content they interacted with. Please note, if you use SSO (Enterprise Customers only) or your viewers authenticate to watch your touchcast, this information will be displayed with the viewers name. However, if you choose not to force authentication/validation, or you share your touchcasts with a public URL, each unique viewer will be shown as an anonymous session.
Combined Analytics
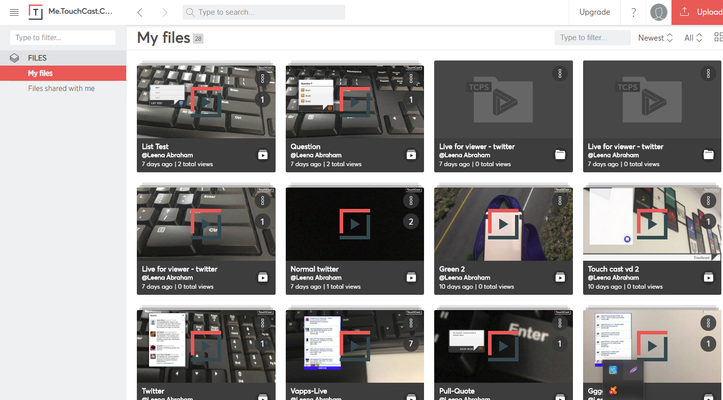
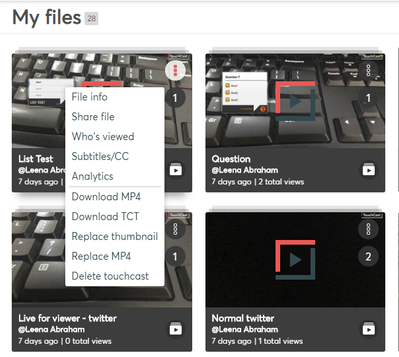
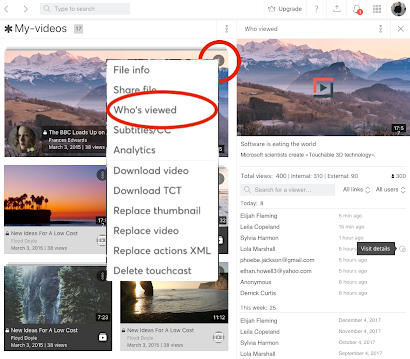
1. To see the combined analytics for a touchcast, tap on the 'File Options' menu on the top right corner of the touchcast thumbnail and select 'Analytics'.
2. A new Tab will open in your browser and display the aggregated results for your touchcast.
Individual analytics
Track all the views for a specific user when they have authenticated via email or email domain or using single sign on. Viewers who have not authenticated will still appear as unique anonymous sessions.
Fabric will now track:
- How much time a viewer spends during each visit.
- What vApps a viewer has clicked on during each session.
- How much time a viewer spent on a vApp in each session.
All this data can be found inside the ‘Who's viewed panel’ within Fabric Portal.
There is also the ability to export this data to a CSV file.